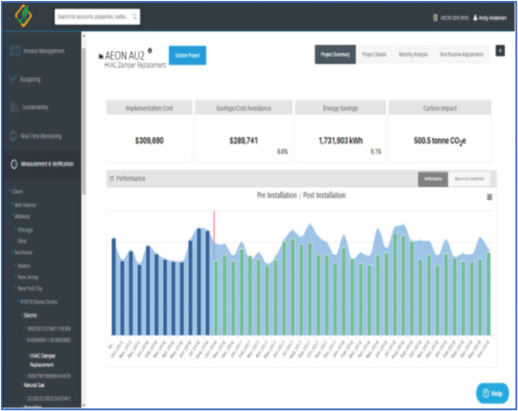
Measurement & Verification


Facility Management &
System Dashboard
The Dashboard will show you ...
- How many inspections are done, weekly or monthly?
- How many work orders are completed?
- Summary of completed, pending, and in-progress tasks
- Are there any issues detected?
- What is happening in various departments and facility?
- Are work orders completed in a timely manner?
- Are preventive maintenance checks happening regularly?

